
Price persistence survived another negative fund week. The longer demand window weakened, and new custody evidence adds a separate risk to watch.
Reporting week: October 12 to 18, 2026. Evidence cutoff: October 18, 2026, 19:09:03 PDT / October 19, 02:09:03 UTC.
Bitcoin’s fund outflows slowed, but buyers did not regain the initiative in the measured channel. Farside’s complete October 12 to 16 window recorded $228.4 million of net outflows, following $678.9 million in the preceding five sessions. Coin Metrics’ October 18 daily reference was $81,935.17, down 2.03% over seven days. All seven completed daily references still exceeded the retained $80,000 trigger. [1,2]
The distinction matters: a smaller withdrawal is an improvement in pace, but it does not meet a test requiring net inflows. The twenty-session total also fell. Meridian’s qualitative assessment remains uneven recovery, with persistent demand weakness. The tactical posture stays cautious. The medium-term assessment weakens within its conditional stance because the additional negative window anticipated in the prior report has now occurred.
Custody deserves its own attention. Fresh investigation evidence concerning devices sold through CryptoBilis adds an operational risk that neither a price level nor rising network computation can answer. This report separates that evidence from Bitcoin’s protocol operation and from conclusions about every custodian.
Executive snapshot
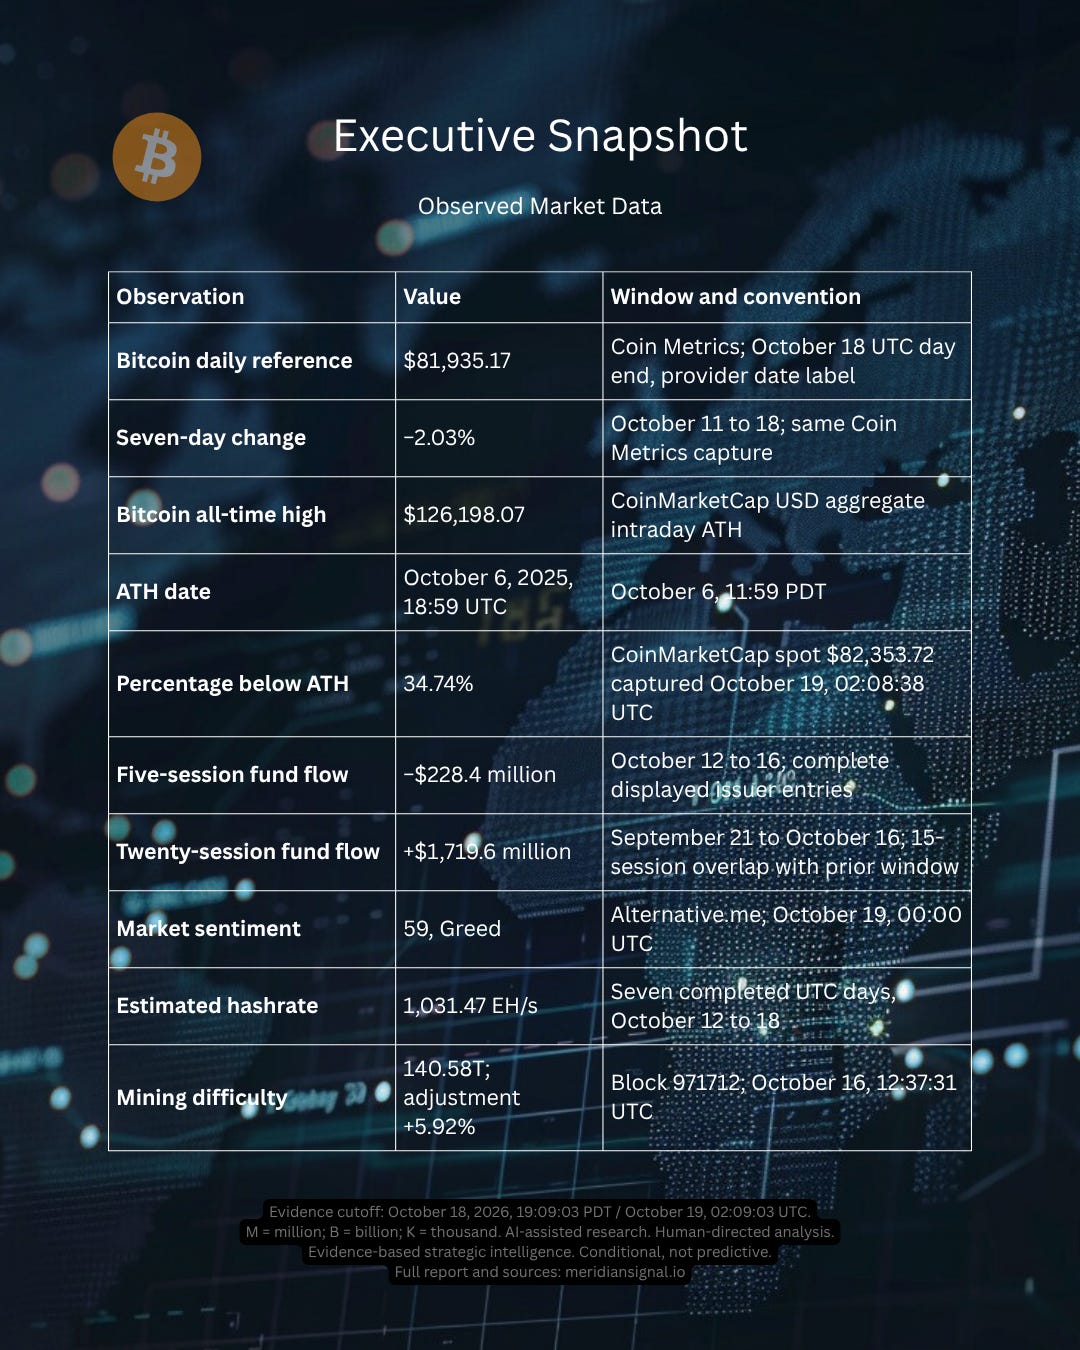
EH/s means exahashes per second; T means trillion in the dimensionless difficulty figure. The spot reference used for the ATH comparison is different from the daily reference used for the weekly return. Both are labeled because the observation times and provider conventions differ. [1–5]
Last issue’s test
WCIR 030, published October 12 Pacific time, retained $80,000 and $76,000 and a duration of three consecutive completed Coin Metrics UTC daily references. Its constructive-continuation case also required a complete positive October 12 to 16 fund window and a positive twenty-session total no lower than the prior completed comparable total. Its separate deterioration case required three daily references below $76,000 together with a complete negative five-session flow window.

Full constructive confirmation remains absent. The evidence continues to fit uneven recovery. The reference levels and duration are unchanged. They are intermediate research triggers, not proven support or resistance and not sufficient on their own to establish a market regime.
The public page’s publication timestamp is October 13 at 05:20 UTC, equivalent to October 12 at 22:20 PDT. Publication time and its earlier October 11 evidence cutoff are different events. This edition compares the original conditions with current evidence without rewriting the earlier assessment.
ATH restored, with a defined comparison
The Bitcoin all-time high is $126,198.07 on October 6, 2025 at 18:59 UTC, using CoinMarketCap’s USD aggregate intraday series. Its latest retained page-data record continued to identify that high at this cutoff. The unrounded high is $126,198.06960343386; the same returned statistics supplied a spot reference of $82,353.7177885799. [3]
The descriptive calculation is 100 × (ATH − spot reference) ÷ ATH, producing 34.7424900814%, displayed as 34.74% below ATH. The source capture completed at 19:08:38 PDT, 25 seconds before the evidence freeze. A separate quote-update timestamp was not exposed for that statistics object, so this is explicitly a retrieval-time snapshot, not a claim of a trade at the exact freeze second.
CoinGecko independently reports a $126,080 USD aggregate ATH on the same date, at 10:57:42 UTC. Its high is about $118.07 lower. Both providers document filtered, volume-weighted aggregation, but their market inputs, conversion processes, filtering and record timestamps differ. The independent evidence corroborates the date and approximate scale, not an identical tick. We retain CoinMarketCap’s record rather than averaging the two. [3,4]
This restores the intraday ATH comparison after earlier editions displayed a bounded daily-reference maximum. The previous $124,824.45 figure was a different statistic and was correctly limited to the downloaded Coin Metrics daily history. It is not relabeled as ATH. Weekly returns and price-persistence tests continue to use Coin Metrics exclusively; no historical price series has been spliced. Distance below a record is descriptive drawdown context, not a valuation discount or evidence that the old high must be revisited.
Price structure and institutional demand
The standard seven-day comparison runs from October 11’s $83,636.61 to October 18’s $81,935.17 in the same captured PriceUSD history. The separate Monday-to-Sunday comparison, October 12 to 18, was +0.16%. A report could sound positive or negative merely by switching those windows. Here the headline uses the established seven-day convention; the within-week comparison is separately labeled. [1]
The daily test also differs from intraday trading. CoinMarketCap’s captured seven-day range included a low below $80,000. That does not contradict the result of a test explicitly defined using completed Coin Metrics daily references. It does show why saying simply that Bitcoin “never fell below $80,000” would be inaccurate. The report claims persistence in the defined daily observations, not an uninterrupted intraday floor. [1,3]
Farside’s five session totals were −$65.4 million, +$175.7 million, −$261.4 million, +$5.1 million and −$82.4 million. October 13 was the strongest session; October 14 was the weakest. Two positive sessions did not offset the three negative sessions. The latest outflow was $450.5 million smaller than the prior week’s, but the required positive window still failed. [2]
Issuer concentration qualifies the improvement. IBIT, the iShares Bitcoin Trust, contributed −$165.4 million, and Fidelity’s FBTC contributed −$60.2 million. Together they accounted for most of the net withdrawal. This differs from WCIR 030, when IBIT was approximately flat while FBTC and ARKB supplied much of the outflow. The smaller aggregate therefore does not establish broad buying across issuers. Fund flows measure this specific U.S. spot-fund channel, not all institutional activity or the intent of every beneficial owner. [2]
The current twenty-session window, September 21 to October 16, totals +$1,719.6 million. The prior September 14 to October 9 window remains +$1,954.1 million in the same current capture. They overlap by fifteen sessions. The $234.5 million decline measures the five entering sessions against the five leaving sessions, rather than comparing independent blocks of twenty observations. The longer total remains a counterweight to the negative week, but it is not a fresh confirmation independent of that week.
No missing issuer cell was found in either comparison window. Zero entries remain zero. October 12 has a fund-flow session even though the Treasury yield release has a holiday blank for that date. Those calendars are not interchangeable. Previously disclosed October 2 revisions are retained in the historical record; they do not produce a new revision claim here.
Macro and liquidity
The Federal Reserve’s October 16 H.15 release reports the five-year inflation-indexed Treasury yield at 2.58% on October 15, four basis points below October 8’s 2.62% used in WCIR 030. Within the current release, October 9’s 2.68% to October 15’s 2.58% is a separate ten-basis-point decline. The latter is Friday to Thursday, not a completed Friday-to-Friday comparison. October 12’s holiday blank is not zero and is not evidence of an unchanged yield. [6]
Lower real yields modestly ease one competing-return measure. They do not establish that all financial conditions have loosened, nor do they mechanically predict Bitcoin demand. This week provides a direct counterexample to a simple one-variable reading: that yield fell while the observed fund channel remained negative.
The October 15 H.4.1 release gives $3,022.140 billion in weekly-average reserve balances for the week ended October 14, down $7.519 billion. The Treasury General Account averaged $883.373 billion, up $3.120 billion. These are averages of daily figures, distinct from the Wednesday observations displayed alongside them. [7]
Those selected balance-sheet changes are less supportive than the prior week’s increase in reserves and decrease in Treasury cash. They also need not offset each other exactly because other balance-sheet items move. The net analytical result is mixed macro context: somewhat lower real yields alongside weaker selected reserve conditions. None of these figures identifies money allocated to Bitcoin or describes global liquidity comprehensively.
Stablecoin coverage remains qualified. The recovered DefiLlama history distinguishes native peg-denominated circulation from USD-valued circulation. Its public headline and API capture did not establish a reconciled, like-for-like aggregate in this review. This edition therefore makes no whole-market supply-growth claim. Mixing the fields would create a misleading total; treating an unreconciled series as zero growth would be equally misleading. Stablecoin balances also cannot by themselves establish intended Bitcoin purchases. [8]
Corporate ownership and financing
Strategy’s October 12 announcement, filed with its October 13 Form 8-K, reports 250 bitcoin acquired for $21.5 million during October 5 to 11, bringing holdings to 848,250 bitcoin at October 11. The reported average acquisition price was $86,194, including fees and expenses. Funding comprised $21.0 million of common-share net proceeds and $0.5 million of USD Cash. These are prior-period transactions disclosed during the reporting week, not evidence of purchases during October 12 to 18. [9]
The company also reported $192.4 million of STRC preferred-share repurchases, with USD Cash at $640.5 millionand its separate USD Reserve at $4.88 billion. The reserve is intended to support preferred dividends and debt interest. Purchases, repurchases, obligations and available issuance capacity describe different uses or sources of capital; they should not all be counted as future Bitcoin buying. [9]
The October 16 filing adds an actual board declaration of November daily STRC dividends at a 12% annual rate, but payment remains conditional. The shareholder amendments must pass by October 31 at 17:00 New York time, and the amended certificate must be effective by November 1 at 00:01 Eastern time. The filing specifies an alternative if the conditions fail and says the daily dividends and previously declared November 15 dividend will not both become unconditionally payable. [10]
That is more developed than a proposal alone, but still short of implemented daily payments. A declared conditional payment schedule does not demonstrate lower financing risk. For Bitcoin, the relevant questions remain whether corporate financing is available on sustainable terms, how much actually funds purchases, and whether obligations constrain future flexibility. Holdings at one company do not establish durable intent across all owners or create a market floor.
Network operation and miner economics
Mempool’s seven completed intervals mapped to October 12 to 18 average 1,031.47 EH/s, 0.97% above the prior seven-day mean of 1,021.55 EH/s. The endpoint timestamp maps to the preceding completed UTC day, preserving the existing convention. Both seven-day means use one capture. [5]
Difficulty increased 5.9237% to 140.57768 trillion at block 971712 on October 16, 12:37:31 UTC. The adjustment is a protocol parameter change; the weekly hashrate estimate is inferred from block production. They cover different intervals and are not expected to move by the same percentage.
Hashrate Index displayed $36.98 per petahash per day in the retained capture. This is an expected mining-revenue proxy, not profit. Without a separate quote measurement time or a matched weekly series, it is a retrieval-time snapshot rather than a weekly profit comparison. Electricity costs, equipment efficiency, fees and financing determine individual margins. A higher difficulty can pressure a fixed miner’s share of rewards even while estimated network computation remains strong. [11]
Neither metric measures ownership dispersion, operator independence or a price floor. Increased computation does not resolve hardware supply-chain risk. Bitcoin Core 31.1 remains listed; its July 8 release fixes include excessive chainstate disk activity and a private-broadcast address leak. Release availability is not proof of adoption or a new event this week. [12]
Custody: a material addition to the risk assessment
Coverage update, October 18: WCIR 030 disclosed that its custody review was incomplete. The present review adds specific incident evidence; it does not imply the event began this week or that the prior limitation established safety.
Ledger’s retained public statement about the October 9 draining incident links its confirmed cases to devices sold through CryptoBilis and says Ledger’s systems and direct sales channels were unaffected. Those are the company’s claims, not an independent clearance of every device. Its reseller data also labels CryptoBilis sales temporarily paused. [13]
Bitquery’s investigation, updated October 16 at 15:00 UTC, estimates $102.0 million taken from 335 wallets across six chains, including Bitcoin. This is an investigator’s multi-asset estimate, not $102 million of Bitcoin losses. Its wallet count rose from 324 to 335 without changing the dollar estimate. The page also corrects an earlier attribution of THORChain vault activity and removes a Binance lead. Those revisions matter when distinguishing transaction tracing from attribution. [14]
Meridian’s inference is that device provenance and recovery-secret handling warrant closer scrutiny. The evidence does not establish a failure of Bitcoin consensus, every hardware wallet, or every institutional custodian. Comprehensive custody coverage remains unavailable. The long-term stance therefore retains its constructive thesis while adding an explicit custody watch. Wider confirmed exposure, persistent losses despite remediation, or inability to establish affected scope would weaken that stance; credible containment and clearer scope would reduce this concern.
Sentiment, changes and contrary evidence
Alternative.me’s 59, Greed, at October 19, 00:00 UTC is ten points below the preceding October 12 observation of 69. Sentiment remains partly derived from market inputs, so it is not independent confirmation of demand. The label does not overrule complete flow evidence. [15]
The strongest case for improvement is concrete: daily price persistence survived, the outflow amount shrank, the longer fund total remained positive and the selected real yield fell. The strongest case against a recovery upgrade is equally concrete: two successive complete fund windows were negative, the twenty-session total declined again, and custody evidence adds an operational vulnerability that prices cannot validate away.
The new custody evidence changes the breadth of the risk assessment. It does not justify retroactively saying that a previously untested custody condition failed, or inventing a probability of wider compromise. The next useful evidence is scope and remediation, not a stronger adjective.
Conditional paths and Horizon Posture
Constructive continuation: retain three consecutive completed Coin Metrics UTC daily references above $80,000, a complete positive next five-session fund window, and a positive twenty-session total no lower than this edition’s comparable +$1,719.6 million. The next standard fund window is October 19 to 23, subject to actual trading sessions and complete issuer data. Any revised comparison base must be disclosed before reassessment. This rolls the observation window forward without changing the condition.
Uneven recovery: price persistence remains while demand is mixed or weaker. This is the current closest fit. A smaller negative window may improve pace without meeting continuation. Missing essential data would leave the dependent condition unresolved rather than supply an implicit pass.
Deterioration: retain three consecutive completed daily references below $76,000 together with a complete negative five-session fund window. An intraday breach alone is insufficient. This combined case was not met this week, even though the flow component was negative.
Long term: Constructive and thesis-led, with custody watch. Evidence of resilient use and financing supports the thesis. Persistent protocol impairment, broader verified custody failures or unsustainable financing would weaken it. Containment of the documented device incident would address one concern without proving all custody arrangements safe.
Medium term: Conditional, with persistent demand weakness. The additional negative complete window fulfills WCIR 030’s stated evidence that would weaken this horizon. Recurring complete inflows, broader issuer participation and stabilization of the twenty-session total would strengthen it. More outflows or financing stress would weaken it further.
Tactical: Cautious, with price persistence intact. Joint price-and-flow confirmation would strengthen the view; the retained deterioration combination would warrant a more adverse reading. No level change is introduced merely because spot prices or the ATH comparison differ from daily observations. These are interpretive conditions, not portfolio instructions.
Meridian strategic conclusion
The useful improvement this week is a smaller withdrawal from the measured fund channel. The unresolved task for the recovery is to turn that into sustained positive demand. Until complete inflows return and the longer window stabilizes, the evidence supports caution rather than a recovery upgrade.
The restored ATH supplies historical drawdown context with an explicit provider and reference price. It does not replace the tests that govern the current assessment. Likewise, network computation cannot compensate for custody weaknesses. The next review must assess demand, price persistence and operational containment on their own evidence.
Sources and observation conventions
Coin Metrics Community API. BTC PriceUSD; 656 consecutive daily observations from January 1, 2025 through October 18, 2026. UTC day-end convention; provider date labels retained. Same capture for weekly comparisons; revisions possible.
Farside fund-flow history. USD millions; displayed daily totals, complete issuer sample, rounded component sums may differ slightly. Windows and overlap specified above.
CoinMarketCap Bitcoin and official price methodology. Historical intraday USD aggregate ATH and same-payload spot, captured October 19 at 02:08:38 UTC. No separate quote-update time exposed.
CoinGecko Bitcoin API and methodology. Independent provider corroboration; returned update October 19 at 02:01:55 UTC. Provider precision and timestamp retained.
Mempool mining endpoint. Interval end mapped to preceding completed UTC date; difficulty event distinguished from estimated weekly computation.
Federal Reserve H.15, October 16 release, latest displayed observation October 15. Prior observation retained from WCIR 030’s source capture. No FRED dependency.
Federal Reserve H.4.1, October 15 release; weekly averages for week ended October 14. Original units USD millions.
DefiLlama stablecoins and history API. Accessible but aggregate reconciliation and coverage not established here; no aggregate growth conclusion.
Strategy October 12 announcement, filed October 13; transaction period October 5 to 11. SEC filing inventorychecked for intervening filings.
Strategy October 16 filing, event October 15. Conditional board declaration, not completed payment implementation.
Hashrate Index. Retrieval-time revenue proxy; not net profit or a weekly average. Exact retrieval time is in the source map.
Bitcoin Core 31.1, release index and advisories. Scoped software evidence, not adoption or a custody census.
Ledger public statement and reseller directory. Vendor statements and distribution status captured before cutoff; the statement concerns the earlier October 9 incident.
Bitquery investigation. Researcher’s October 16 update; revised estimates and attribution, not an independently reproduced transaction census by Meridian.
Alternative.me. October 19, 00:00 UTC observation; partly market-derived.
The accompanying source map records individual retrieval times and limitations. The workbook retains source inputs and descriptive formulas. No proprietary score, probability, price target or transaction instruction is assigned.
Editorial Note
The Bitcoin Evidence-Led Series distinguishes sourced observations, descriptive calculations and Meridian’s qualitative assessments. Each edition reflects the evidence available at its stated cutoff; source data may subsequently be revised.
Meridian Signal uses artificial intelligence to assist source discovery, comparison, drafting and arithmetic verification. Final review and editorial responsibility rest with Meridian Signal. Material limitations are disclosed, and corrections to prior reporting are identified explicitly.
Research Disclosure
This report provides general informational and educational research, not personalized investment, legal or tax advice or an instruction to transact. Bitcoin is volatile, and loss of principal is possible. Assessments involve uncertainty; conditions and scenarios do not guarantee outcomes.
Meridian Signal
Bold clarity at the right time.
Independent strategic intelligence on capital regimes, digital infrastructure and systemic risk.
AI-assisted. Human-directed.
Evidence-based strategic intelligence. Conditional, not predictive.
Questions or corrections: contact@meridiansignal.io